Measuring Apoptosis by Flow Cytometry
Mitochondria are double-membraned organelles believed to have been integrated into modern eukaryotes via symbiosis of proteobacteria into an anaerobic pre-eukaryotic (host) cell 1.5–2 billion years ago. According to modern thinking (pioneered by Mitchell;), an essential role of mitochondria is to produce ATP via oxidative phosphorylation (OXPHOS). In this process, the chemical energy stored in nutrients (carbohydrates, fats, etc.) is converted to an electrochemical gradient across the inner mitochondrial membrane via the electron transport chain (ETC) complexes. This electrochemical gradient acts as a store of energy. ATP synthase uses this stored energy to convert ADP to ATP. This bioenergetic picture of the role of mitochondria is now widely accepted. A second role of mitochondria is in the so-called intrinsic apoptosis pathway. This pathway converges (figuratively and literally) at the membrane of the mitochondria. Upon certain cell death signals [such as reactive oxygen species (ROS), DNA damage, etc.], the outer membrane of mitochondria becomes permeable enough to release the soluble hemeprotein cytochrome C (CytC), as well as Smac/Diablo, endonuclease G, and other intermembrane space proteins, which irreversibly activate downstream caspases to carry out the apoptosis process.
Apoptosis is a programmed mode of cell death that is accompanied by numerous morphological as well as biochemical changes to the cellular architecture. This results not only in cell death but also in the effi- cient removal of apoptotic cells by phagocytes. Apoptotic cells display a range of common characteristics that include cell shrinkage, plasma membrane blebbing, cell detachment, nuclear condensation, DNA fragmentation, externalization of phosphatidylserine (PS) and activation of caspases. In contrast, necrotic cell death is characterised by rapid plasma membrane, organelle swelling and plasma membrane rupture with none of the features of apoptosis. Apart from severe physical stresses, necrotic cell death often betrays the activities of viral infection and the activities of bacterial toxins. While necrotic cell death is characterized by the release of endogenous ‘danger signals’ and subsequent inflammation, apoptosis is largely tolergenic. Therefore, care must be taken when assessing whether cells are dying via apoptosis or necrosis. Here, we highlight a number of assays, utilizing flow cytometry, to determine whether cells have undergone apoptosis or alternative modes of cell death.
Detection of fragmented DNA by flow cytometry as a measure of apoptotic cell death
Intranucleosomal DNA fragmentation is a major hallmark of apoptosis. DNA fragmentation may be assessed by flow cytometry. Analysis of a cell population’s replication state (cell cycle profile) can be readily achieved with the fluorescent dye Propidium iodide (PI), which binds stoichiometrically to nucleic acids resulting in a fluorescence emission proportional to the DNA content of the cell. The rationale behind the approach is as follows: quiescent and G1 cells have two chromosome copies, while cells undergoing mitosis G2/M have double the amount of DNA and so will have double the fluorescence intensity of G1 cells. Cells in S phase will have a fluorescent signal between G1 and G2/M, because these cells are synthesizing DNA on their way to G2/M (Fig. 3A).
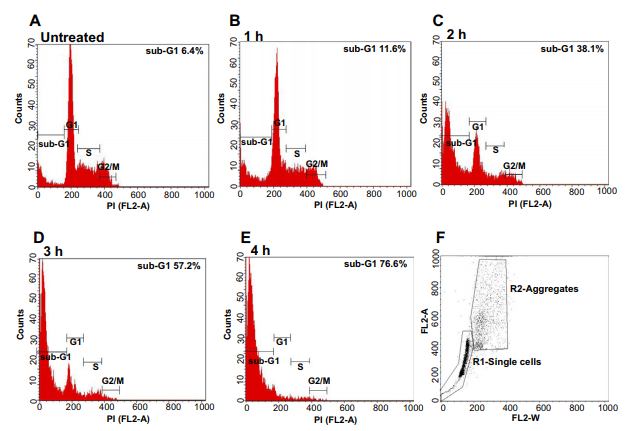
Figure 3. Measure of DNA fragmentation during apoptosis by flow cytometry. Jurkat cells were treated with 200 ng/ml anti-Fas (CH-11). Cells were harvested at indicated timepoints (A–E) and analysed by flow cytometry. (F) Gating strategy to discriminate cells aggregates from single cells.
Due to the generation of lowmolecular weight DNA fragments during apoptosis, cells undergoing apoptosis can be readily identified on DNA content histograms as cells with fractional hypodiploid or ‘‘sub-G1’’ content (Fig. 3B–E). Cellular DNA content is measured using a fluorescent dye after cell fixation with ethanol. Cell fixation does not retain small nuclear fragments in apoptotic cells. These low molecular weight DNA fragments leak out during subsequent wash steps. As a result, apoptotic cells contain a fractional DNA content relative to viable cells that can be readily distinguished by flow cytometry.
Methodology
The following protocol is tailored towards suspension cells, however, if using adherent cells remember to harvest the supernatant (late apoptotic cells become detached and float in the medium) in addition to the adherent/semi adherent cells on the plate and proceed as outlined below:
1.Apoptosis was induced in 2 10^6 Jurkat cells by incubation with 200 ng/ml anti-Fas antibody (CH-11) for 1–4 h. Cells are harvested at the desired time points and centrifuged at 400g for 5 min. Cells are washed with PBS pH 7.2 and centrifuged at 400g for 1 min.
2.Resuspend cells in 1 ml ice-cold 70% ethanol and incubate for at least 1 h at -20 °C to fix (cells can be stored for up to 6 months at -20 °C).
3.Centrifuge cells at 2500g for 5 min (a higher centrifuge speed is required as fixed cells become buoyant and may fail to pellet or stick along the side of the eppendorf). Aspirate off the ethanol without disturbing the cell pellet and resuspend with 1 ml phosphate-citrate wash buffer (200 mM Na2HPO4, 100 mM citric acid) followed by centrifugation at 2500g for 1 min.
4.To stain nuclei, prepare PBS pH 7.2 containing propidium iodide 10 lg/ml and RNase A 100 lg/ml (included to degrade RNA and to prevent PI staining of RNA) and incubate with cells for 30 min.
5.Samples are ready for analysis by flow cytometry (no need to wash out PI/RNase but this can be done if desired).
Setting correct parameters for cell cycle analysis by flow cytometry
A few considerations must be taken into account when using flow cytometry for cell cycle analysis:
A) Ensure that the fluorescence channel 2 (FL2) is set at linear (LIN) scale. It is harder to distinguish the differential fluorescence between G0/G1 and G2/M peaks on a logarithmic (LOG) scale. LIN amplification allows for clear separation between G0/G1 and G2/M peaks.
B) A common problem to control for during cell cycle analysis is aggregation of cells. For example cells can stick together and pass through the flow cytometer’s laser intercept simultaneously. In either case, two cells in G0/G1 that are stuck together or pass through the laser intercept at the same time will have a fluorescence signature equivalent to a cell in G2/ M. Therefore, the number of events recorded as G2/M will be artificially high. A way to exclude these events is by excluding non-single cell events from the analysis using scatter properties (FSC/SSC).
C) To discriminate between cellular aggregation and single cells, select a plot with FL2-A parameter as the y-axis and FL2-W as the x-axis (Fig. 3F). Single cells (G0/G1 or G2/M) will have pulse width values (FL2-W) that are similar, however aggregates will have larger pulse width values (due to increased cell width). In the example (Fig. 3F), single cells have been gated (R1-single cells) and the FL2-A histograms (Fig. 3A–E) have been formatted to display only events within this region (R1-single-cells).
Reference : ScienceDirect Measuring apoptosis by microscopy and flow cytometry